
A failed agent run leaves platform teams with two questions: where did execution break, and what evidence can they safely collect? Anthropic’s October 14 release notes announce beta OpenTelemetry export for Messages API requests and Managed Agents sessions. The implementation decision reaches beyond enabling traces: teams must choose which activity to capture and whether conversation content should leave for an observability provider.
Two routes into the same investigation
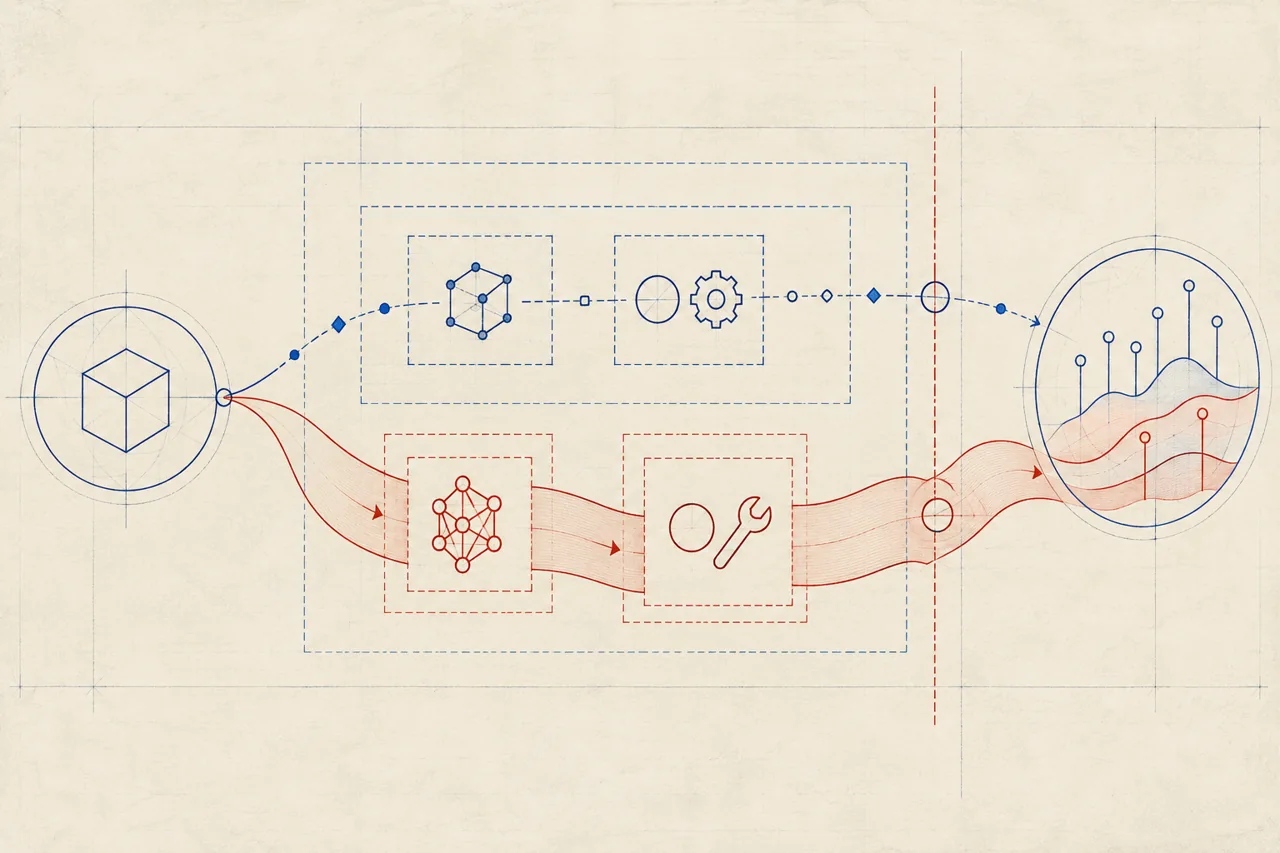
Anthropic’s API tracing guide describes platform-side export without application code changes. An Admin configures a Console destination with an HTTPS OTLP/HTTP endpoint and credentials, scoped to all, selected, or all-except workspaces. That makes destination scope an operational decision alongside instrumentation.
The SDK route requires registering a tracer provider before calls; the application’s exporter sends spans onward. Propagated context can nest SDK activity within application traces. API spans may otherwise form separate traces: W3C traceparent can connect them, although Anthropic documents that header as unsupported on Claude Platform on AWS.
Useful evidence, with coverage boundaries
The overview describes request, model, token, tool, and Managed Agents turn coverage, with differences between SDK and API tracing. These records offer places to investigate errors and execution activity; their availability does not establish that a workflow is correct.
Coverage needs checking against the actual application. The span reference excludes the OpenAI-compatible chat-completions endpoint from API tracing and identifies missing tool spans for some application-run or self-hosted tools. A populated trace therefore should not be read as a complete inventory of everything an agent did.
Full content changes the data boundary
Anthropic documents metadata-only as the default. Full-content tracing can include prompts and responses; its span reference also lists system instructions, tool-call arguments, and tool results among content attributes. The distinction matters when the evidence needed to explain a failure is also material a team would restrict elsewhere.
According to the implementation overview, the destination applies its own retention and access controls after delivery. Enabling export therefore introduces a separate data-handling decision. Metadata-only is a lower-content starting point, not evidence that every metadata field is harmless.
The same guide says Managed Agents is not eligible for zero data retention, and OpenTelemetry does not change its retention. Teams should keep that treatment separate from decisions about exported content.
Token totals need counting rules
More instrumentation can also complicate accounting. Anthropic’s SDK troubleshooting guidance warns that SDK and API spans can both appear for one request; another tracing library can add duplicates.
The reference and companion guidance describe repeated token usage and delivery retries that can duplicate spans. Teams need to select the appropriate usage source and deduplicate by trace and span IDs before aggregating. Simply summing every visible token attribute can produce a misleading total.
Can your team debug the run within its data limits?
Is metadata-only enough for the first incident review?
A bounded pilot should answer that question before expanding collection. Choose API tracing, SDK tracing, or both; set workspace scope and content mode; then inspect delivery, trace nesting, and token aggregation. These are proposed evaluation steps, not reported test results.
The reviewed evidence establishes vendor documentation, not customer-specific access, reliable delivery, or improved debugging outcomes. Anthropic also warns that beta span names and attributes can change. Pinning SDK versions, as its guide recommends, belongs alongside checking that the resulting traces answer the team’s actual incident questions.